Visualizations in Isarsoft Perception
This blog post explains the various Visualizations of Applications and their benefits
Published
January 13, 2023
What is a Visualization?
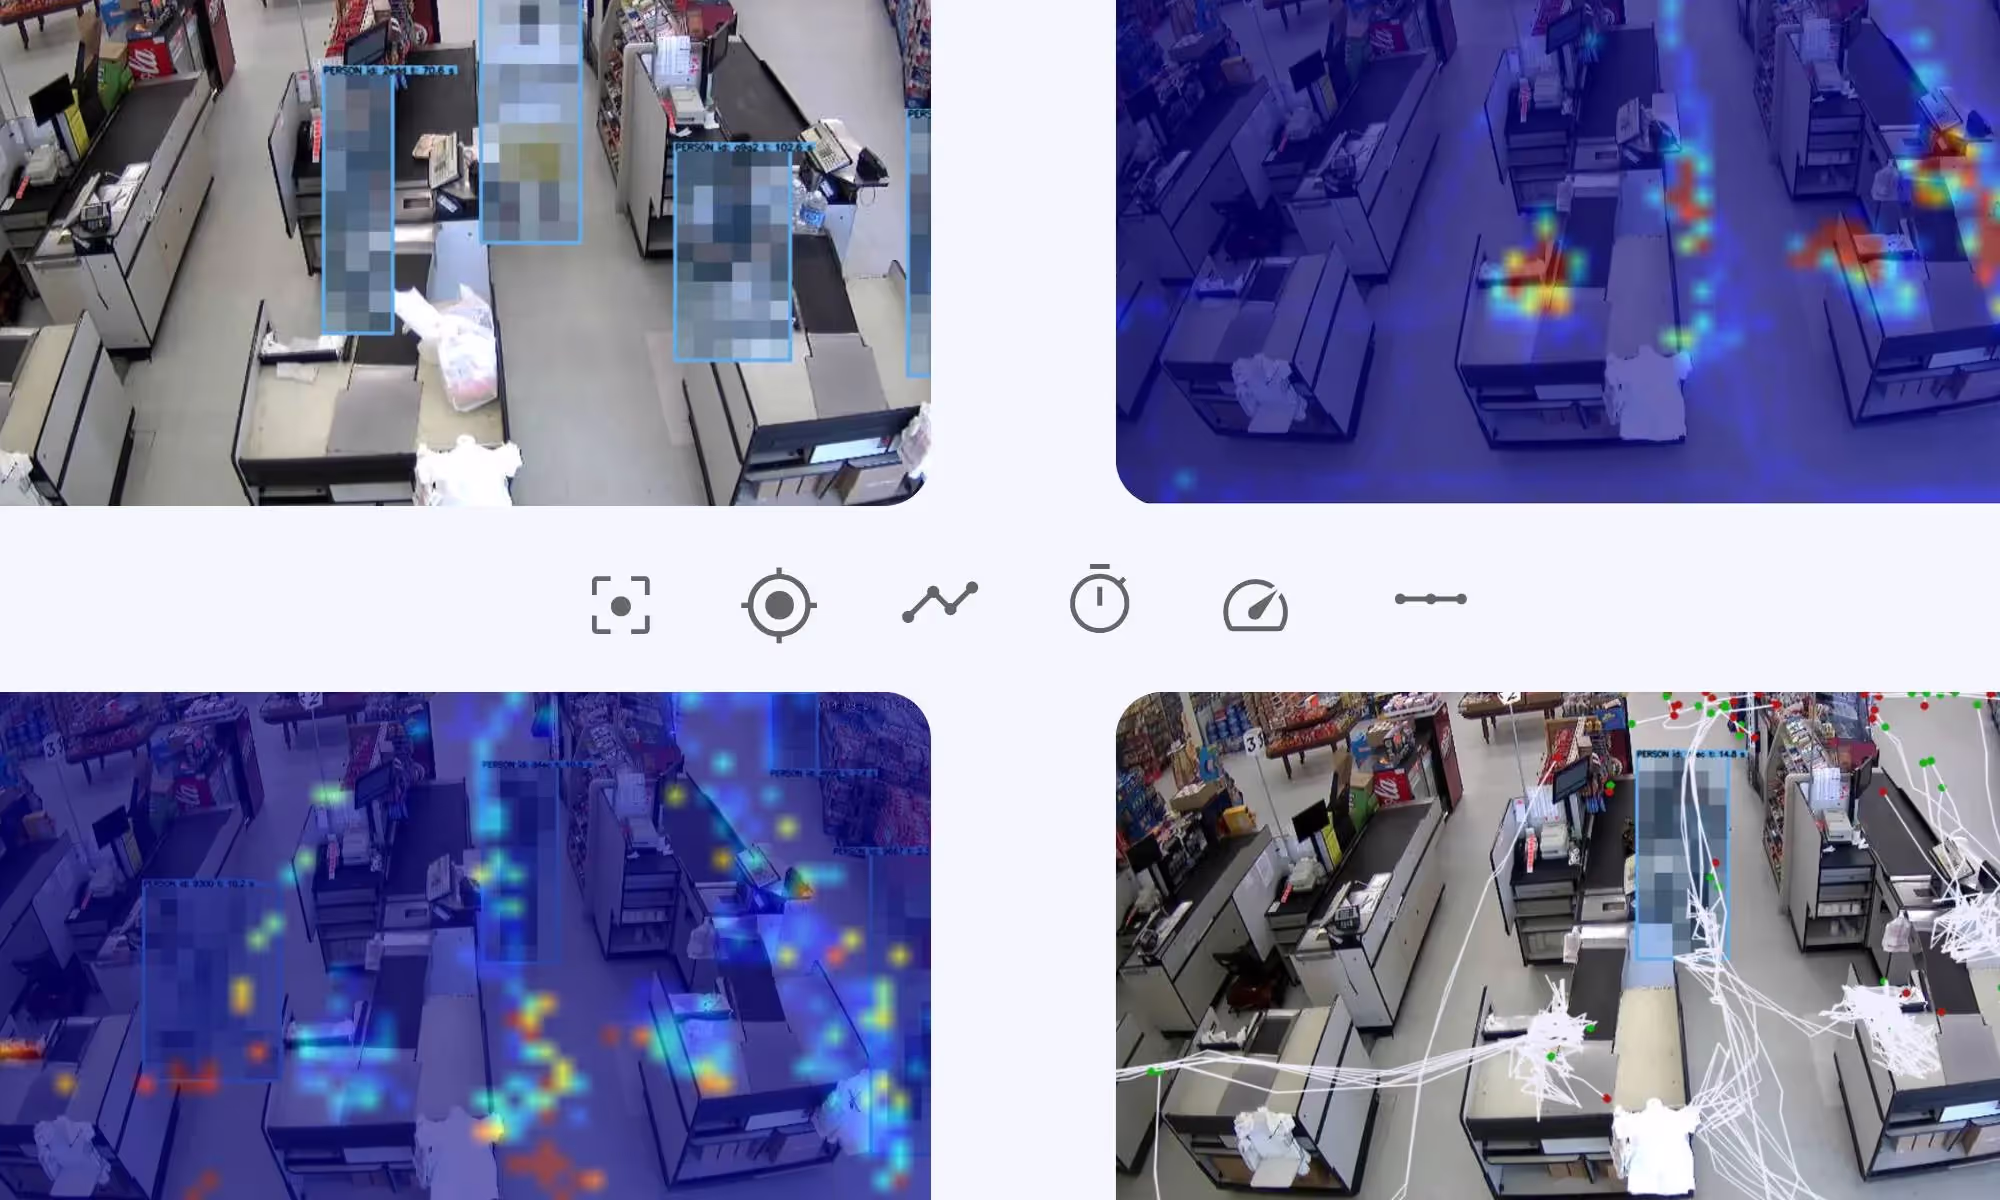
A Visualization is a mode in which the Application can be displayed, all these different modes offer different benefits and thus can be used for different problems. Isarsoft Perception offers six different visualizations, each of them provides different benefits, they are listed below.
Visualization Bar
The Visualization Bar is the white bar under the camera view. The different Visualizations are displayed by the six icons on the left side of the bar. In the middle appears the status of the camera, it is either Online or Offline and on the right side you can maximize the camera view.
Which Visualization mode is currently used, can be seen in the bar and also be changed there.
.jpg)
What is an Application?
Applications are the central component of Isarsoft Perception, as this is where video streams are converted into metadata. KPI´s exist through the Application, because they are filled with the data which the Application generates. It is the Application that makes every camera count.
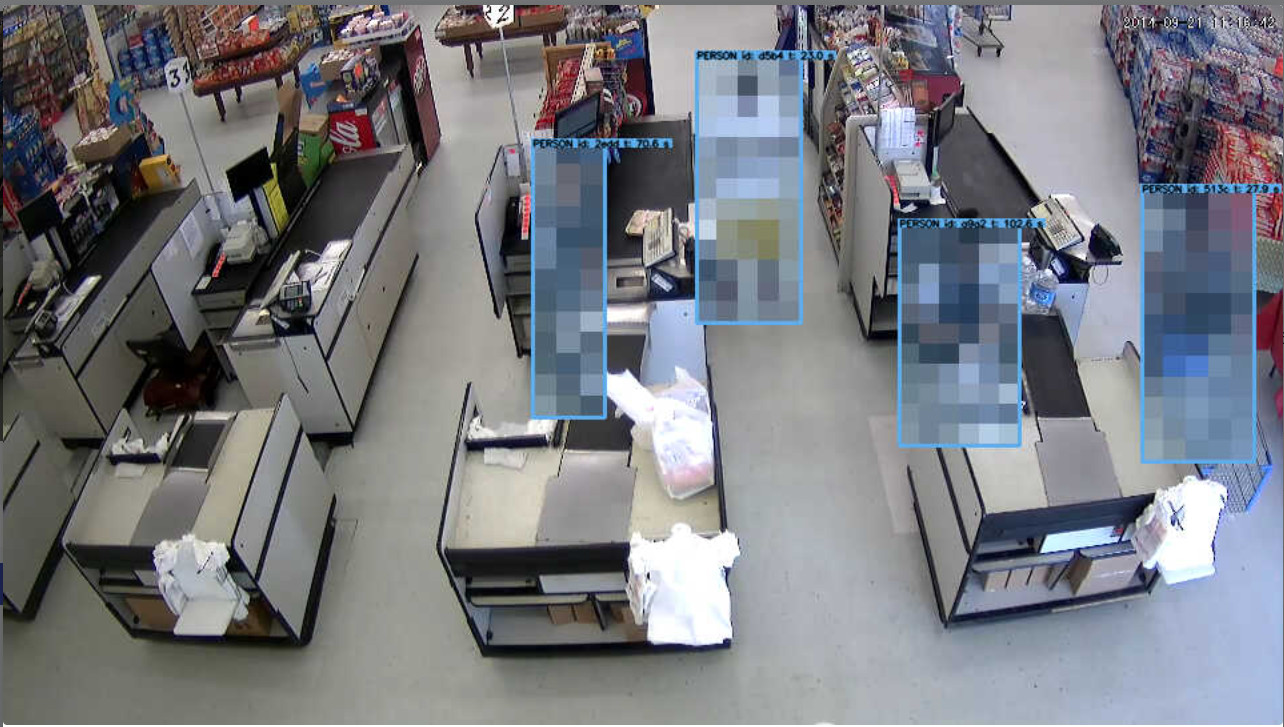
Detection
The usual Application display is the detection view, detected objects are marked with boxes and have their own identification number, which is unique. If the object leaves the video-monitored area and enters the picture again later, the object is given a different number. The boxes exists for anonymizing and adapts to the height and width of the object. Different Models are colored differently, this serves to distinguish them.
The Detection is the mode on the very left side on the bar. Applications are always displayed as Detection in the Content Overview.
Position Map
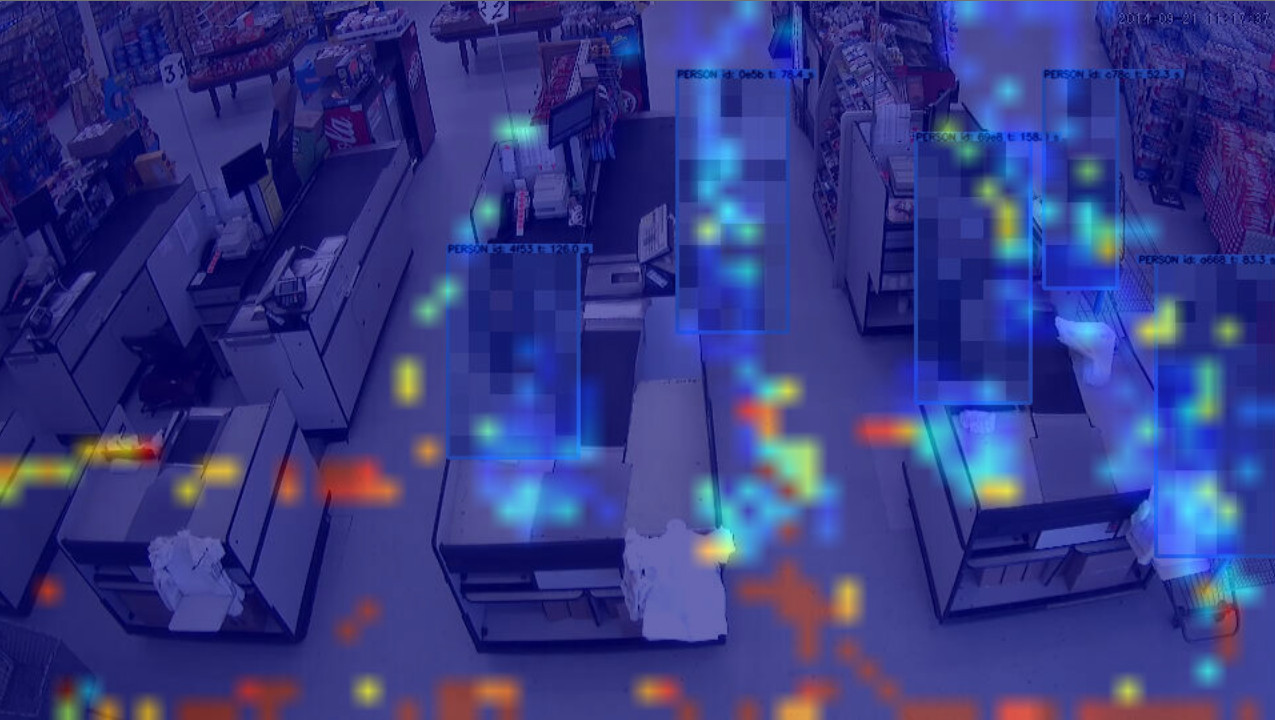
The mode to the right is the “Postion Map”. This setting uses a thermal imaging camera to measure where a particularly large number of objects stayed. This setting is good for determining in which areas objects accumulate more often. If a certain area is marked red, this means that this place is particularly highly frequented, the next smaller gradation is the color yellow, objects are not there as often as in the red areas, but more than in the turquoise or even the blue areas.
This setting can be explained more easily by using an example. If an area in the store is marked in red, this means that costumers are standing here particularly often. One possible interpretation is that this area of the aisle displays a product that many customers are interested in so they stand there a lot.
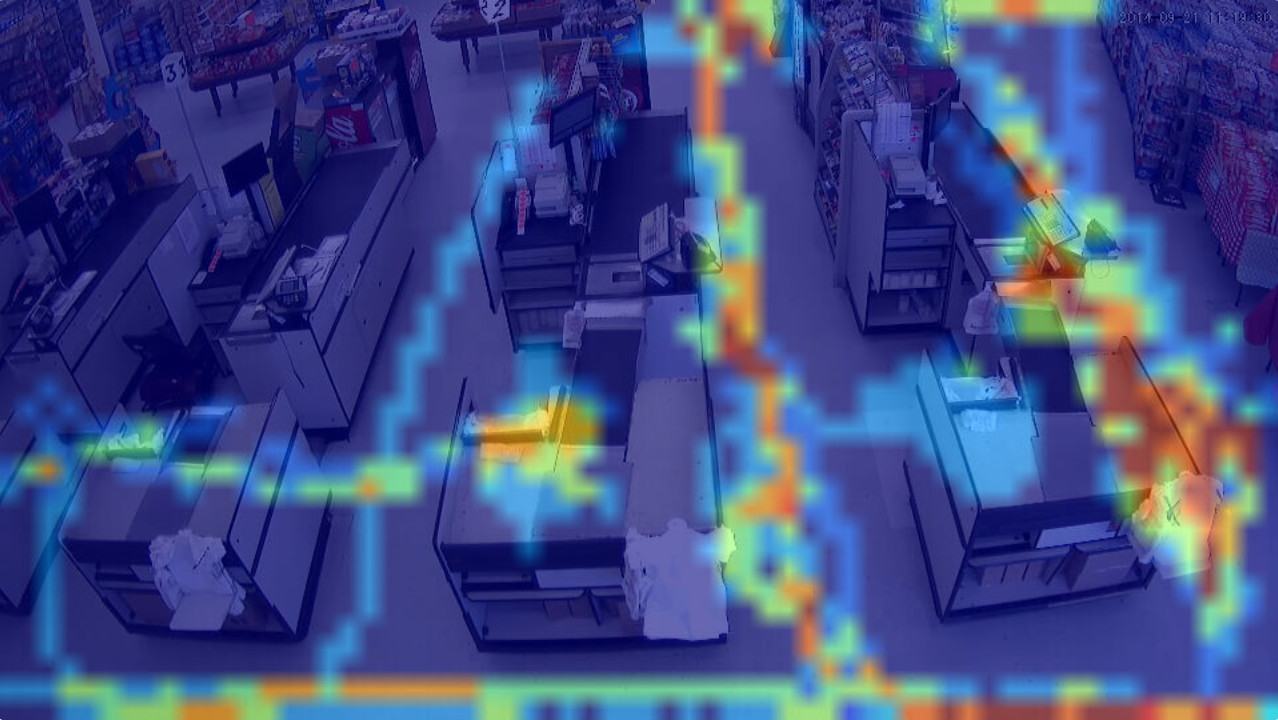
Path map
The next setting is the "Path Map", it makes clear which paths objects have used particularly frequently. This setting is also enabled by a thermal imaging camera and uses the same color scheme and gradation as the Position Map.
A possible example for the red or yellow paths so the "highly frequented paths" is that this paths lead through aisles that displays products which are bought more often. That helps to detect bestselling products.
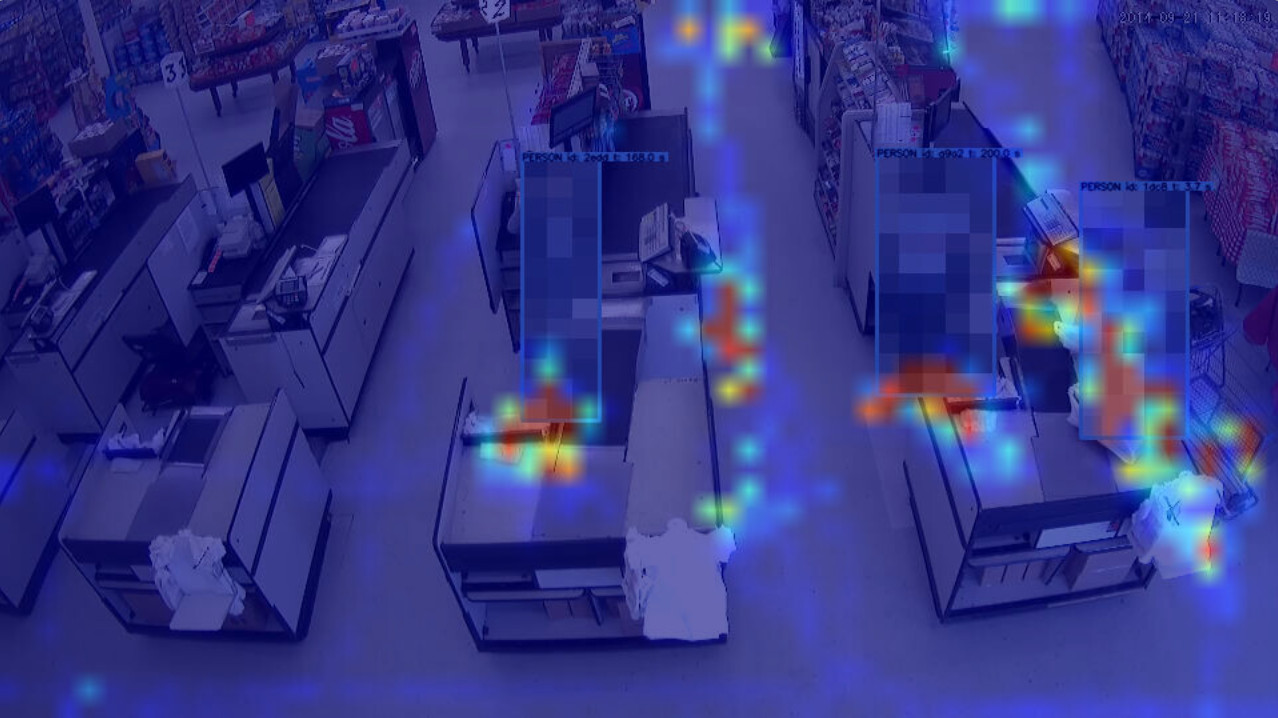
Dwell Time
The next setting is the "Dwell Time", this mode shows in which areas objects stay for a long time. A thermal imaging camera is used and the same color scheme applies as before. Red stands for a long dwell time and turquoise for a short dwell time and blue for no dwell time.
This setting can be used in retail to improve customer management. If a customer is identified, by the Dwell Time function, who has been standing in front of a shelf for a long time, it can be assumed that the person is searching for something and needs help. But Dwell Time can also be used for queue management, if there are a lot of red marks in front of a cash out people are waiting there a lot.

Velocity Map
Another mode is the "Velocity Map", as the name suggests, this is about the speed of the recorded objects. The speed of the objects is determined by the thermal imaging camera, the same color scheme applies as for the previous settings, red stands for high speed and turquoise for low speed.
This visualization is particularly suitable for recognizing unpopular aisles and thus unimportant products. With this setting retailers can determine the range of products more precise.
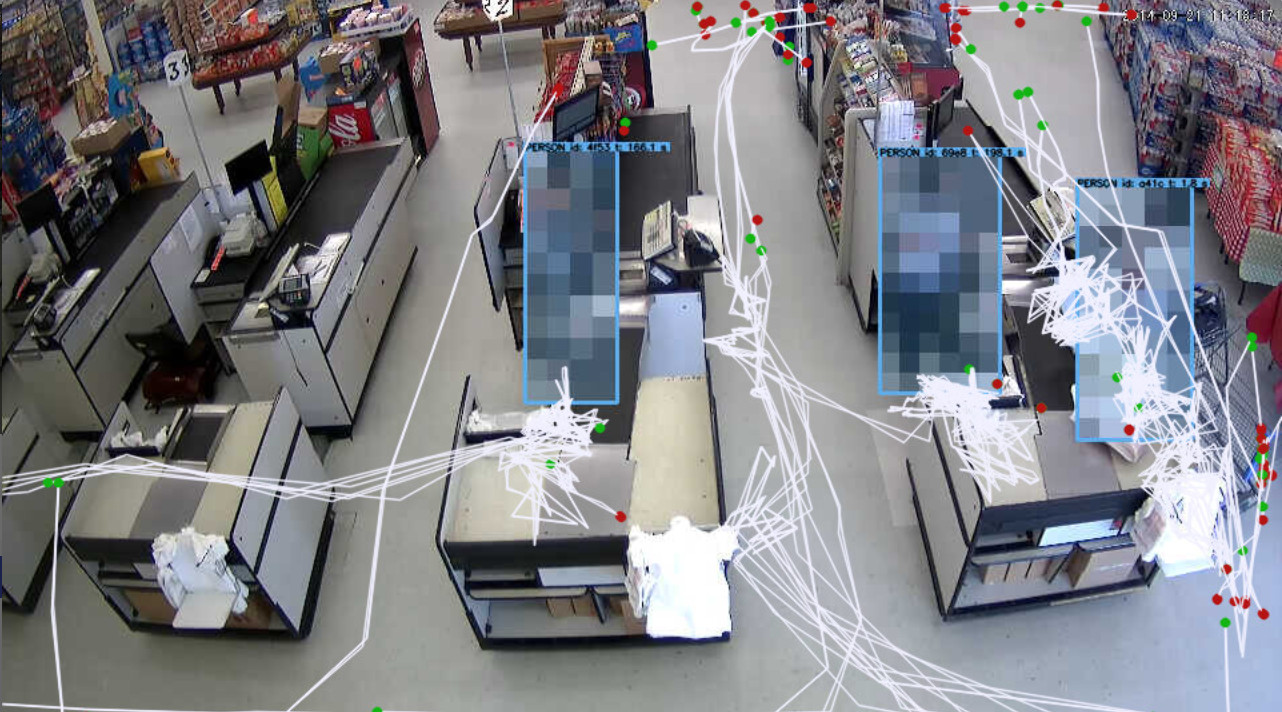
Trajectory Map
The last setting option is the "Trajectory Map", this setting uses white lines to show the exact paths of the individual objects. The green dot represents the start point, which is where the object started to move. The red dot represents the end point, where the object stops moving.
People who are searching for a specific product can be detected by this visualization it shows the exact ways a customer walked, where the person stopped and where they continued walking. A line that appears a lot at same area can be a sign of confusing product displaying.
More about Isarsoft
With Isarsoft Perception, your camera systems become part of your business intelligence. Whether the goal is to increase efficiency, customer satisfaction or safety, Isarsoft Perception provides the insights needed for informed decisions.
Contact us, to learn more about how to turn security cameras into intelligent sensors.
Explore More Publications
Meet Isarsoft at the EuroShop 2026 in Düsseldorf
Isarsoft is excited to announce our participation in the EuroShop 2026, the world’s no. 1 retail trade fair. Join us in Düsseldorf this February to explore how intelligent video analytics can revolutionize customer journeys in retail.

AI in Traffic Management
Explore how AI in traffic management is transforming urban mobility. Learn how intelligent traffic management systems use artificial intelligence to optimize traffic flow, reduce congestion, and enhance commute efficiency.
Isarsoft Achieves ISO 27001 Certification
Isarsoft has successfully achieved ISO/IEC 27001 certification from TÜV, underscoring our commitment to the highest standards of privacy, information security, and risk management.