How does Isarsoft Perception measure and monitor occupancy using heat maps?
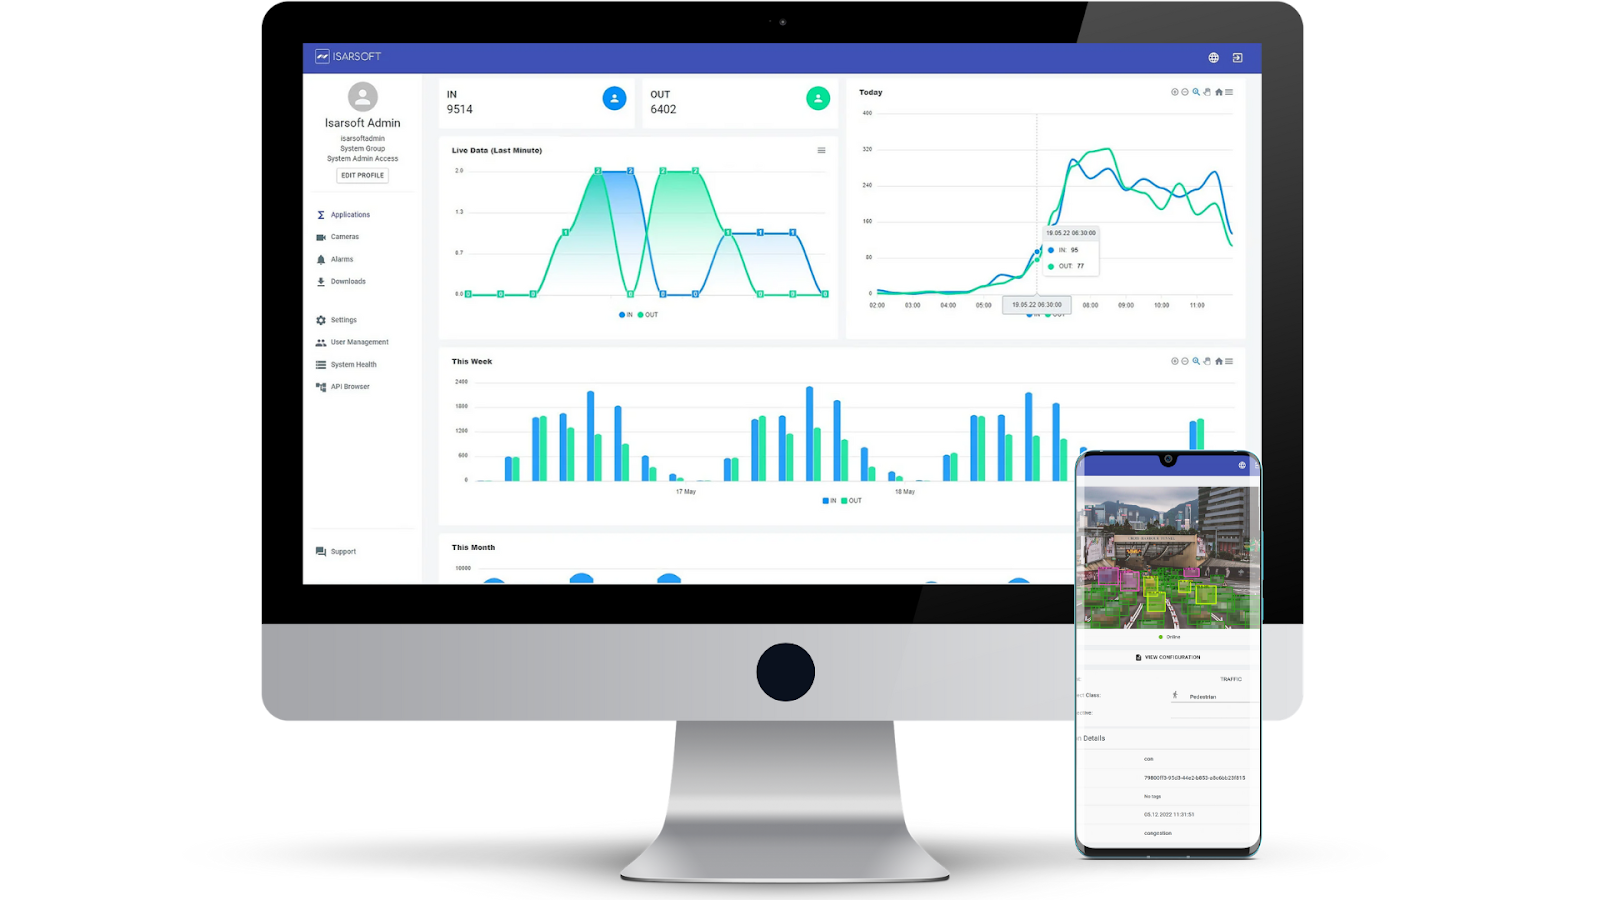
A brief overview of Isarsoft's Perception occupancy monitoring feature, in the context of a train station.
Published
December 30, 2022
.avif)
What are heat maps?
A heat map is a specific data visualization technique wherein values are depicted by color. The magnitude of the phenomenon under observation is depicted as color in two dimensions. The variation in displayed color is generally by intensity or hue, to better highlight how the phenomenon is clustered or varies over space.
The benefits of a heat map are manifold and often depend on circumstance. It is meant to simplify the graphical representation of data and improve the bottom line by visualizing the volume of events using a dataset.
crop.png)
How is Isarsoft Perception’s functionality defined in this domain?
The Isarsoft Perception suite of applications includes heat maps in order to enable users to access a simplified way of evaluating their requirements. The heat map can be used to perform an array of different functions; measure and monitor occupancy, assess dwell time and categorization by velocity.
Each of these functions serve a different purpose and allow customers to access data that boosts, optimizes and streamlines.
In this case study, we will examine the case of occupancy monitoring in train stations, using heat maps. Train stations are crowded places, and are subject to moving crowds all throughout the day. A feature like the heat map is particularly useful for problem analysts and security personnel because it visualizes the data in a way that is instantly comprehensible and draws focus to problem areas. As a result, analysts can respond more quickly and resolve existent issues.
Monitor Station Occupancy
One of the main applications of a heat map in a train station is to be able to monitor occupancy rates. It is an effective way of keeping track of busy and idle times, according to time of the day, day of the week or month.
Once a pattern is established, it can be used to track trends and thereby create a system of anticipatory protocol. For example, the onset of a festival can be used as an indicator of increased crowds and can thereby be used to deploy more trains at peak timings, personnel to manage crowds and even introduce temporary fixtures to make sure safety protocols are followed.
crop.png)
Train stations in Germany, being considerably sized and many in number, naturally use a lot of resources daily. Monitoring station occupancy can help implement a system of effective energy usage and ensure that there is not a lot of unwarranted wastage of the same.
Finally, tracking the occupancy of train stations greatly simplifies the jobs of those employed on-site by allowing them access to accurate, real-time data.
Efficient Usage of Space
When planning the layout of a structure, the architect and designers have to take a lot into account. With the introduction of smart technology into train station planning, one can now manage available space more efficiently with relevant insights at their behest.
With the help of an occupancy monitoring system, planners can assess current utilization of space and identify areas that may be under-utilized, obscured from view or prone to overcrowding. By having this information, infrastructural changes can be implemented in order to build a structure that is more easily navigable.
The assessment of space can also be used for other purposes such as the creation of a safer, more user-friendly structure. As a fixture of German cities and towns, train stations are frequented by people of all ages and economic levels. In order for a train station to reach maximum capacity of usage, it has to be built in a way that allows commuters of all kinds to use the facilities with ease.
With Isarsoft Perception’s intuitive data collection and analysis methods, planners can evaluate the available space and integrate missing features. Some examples include conveniently placed elevators and escalators, wheelchair ramps and adequate seating.
Prevention of Overcrowding
Overcrowding is a cumbersome, and potentially dangerous phenomenon common to train stations. There are many ways to keep large crowds from forming. Some of these have been practiced since a very long time, such as manual counting, but no longer rank high in terms of efficiency.
Isarsoft Perception uses heat maps to keep track of people in the station at any given point in time, and to prevent crowds from forming. How? As explained previously, heat maps are graphical visualizations of events, done with the help of datasets and explained via color. The same logic applies to a crowd, either in the process of formation or already
The feature allows personnel to identify a crowd, and attend to it very quickly. The data provided is accurate and leaves little room for chance. Heat maps prove particularly useful in cases of high traffic times of the day, when personnel might not have time to do much else than to glance quickly at the image and be able to immediately estimate the scenario.
More about Isarsoft
With Isarsoft Perception, your camera systems become part of your business intelligence. Whether the goal is to increase efficiency, customer satisfaction or safety, Isarsoft Perception provides the insights needed for informed decisions.
Contact us, to learn more about how to turn security cameras into intelligent sensors.
Explore More Publications
.avif)
Optimizing the EES bottleneck: Why Airports choose Video Analytics for Queue Management
With the real-world EES processing times taking up to 5 minutes per passenger, legacy airport queue models have officially collapsed. Discover how airports are using AI-powered video analytics to transform their existing cameras into predictive tools that eliminate terminal bottlenecks before they form.
.avif)
Video Analytics or Sensors? Finding the best People Counting Tech for your Business
Do you want to improve your business by adopting a people counting solution but feel overwhelmed by the options? With video analytics and sensor-based technologies offering different advantages, choosing the right system can be challenging.
.avif)
Who are your customers? Detection of age, gender, and group size in retail
Retail stores are often a blackbox when it comes to customer demographics. When POS checkout systems and customer loyalty programs do only reveal a part of the story, video analytics can now cluster store visitors in age groups and match them to male and female gender.