Performance Measurement in Retail - Top 10 KPIs for Every Retail Business
An effective measurement of performance in retail is a combination of the right tools and the right metrics. In this article, we outline the top 10 KPIs used to conduct retail-oriented performance analysis, and why.
Published
May 31, 2023

What is a KPI?
KPI is short for Key Performance Indicator- a term used to denote quantifiable performance measurement.
KPIs are used to assess the performance of a subject based on a roster of predefined criteria, and use the data to improve and alter operational processes, analyze efficacy and make relevant decisions.
Top 10 KPIs for Retail
Footfall
The term footfall is used to describe the number of people in a shop or store, in any given period of time. Footfall is a metric used to measure sales performance, marketing campaigns and the efficacy of infrastructure.
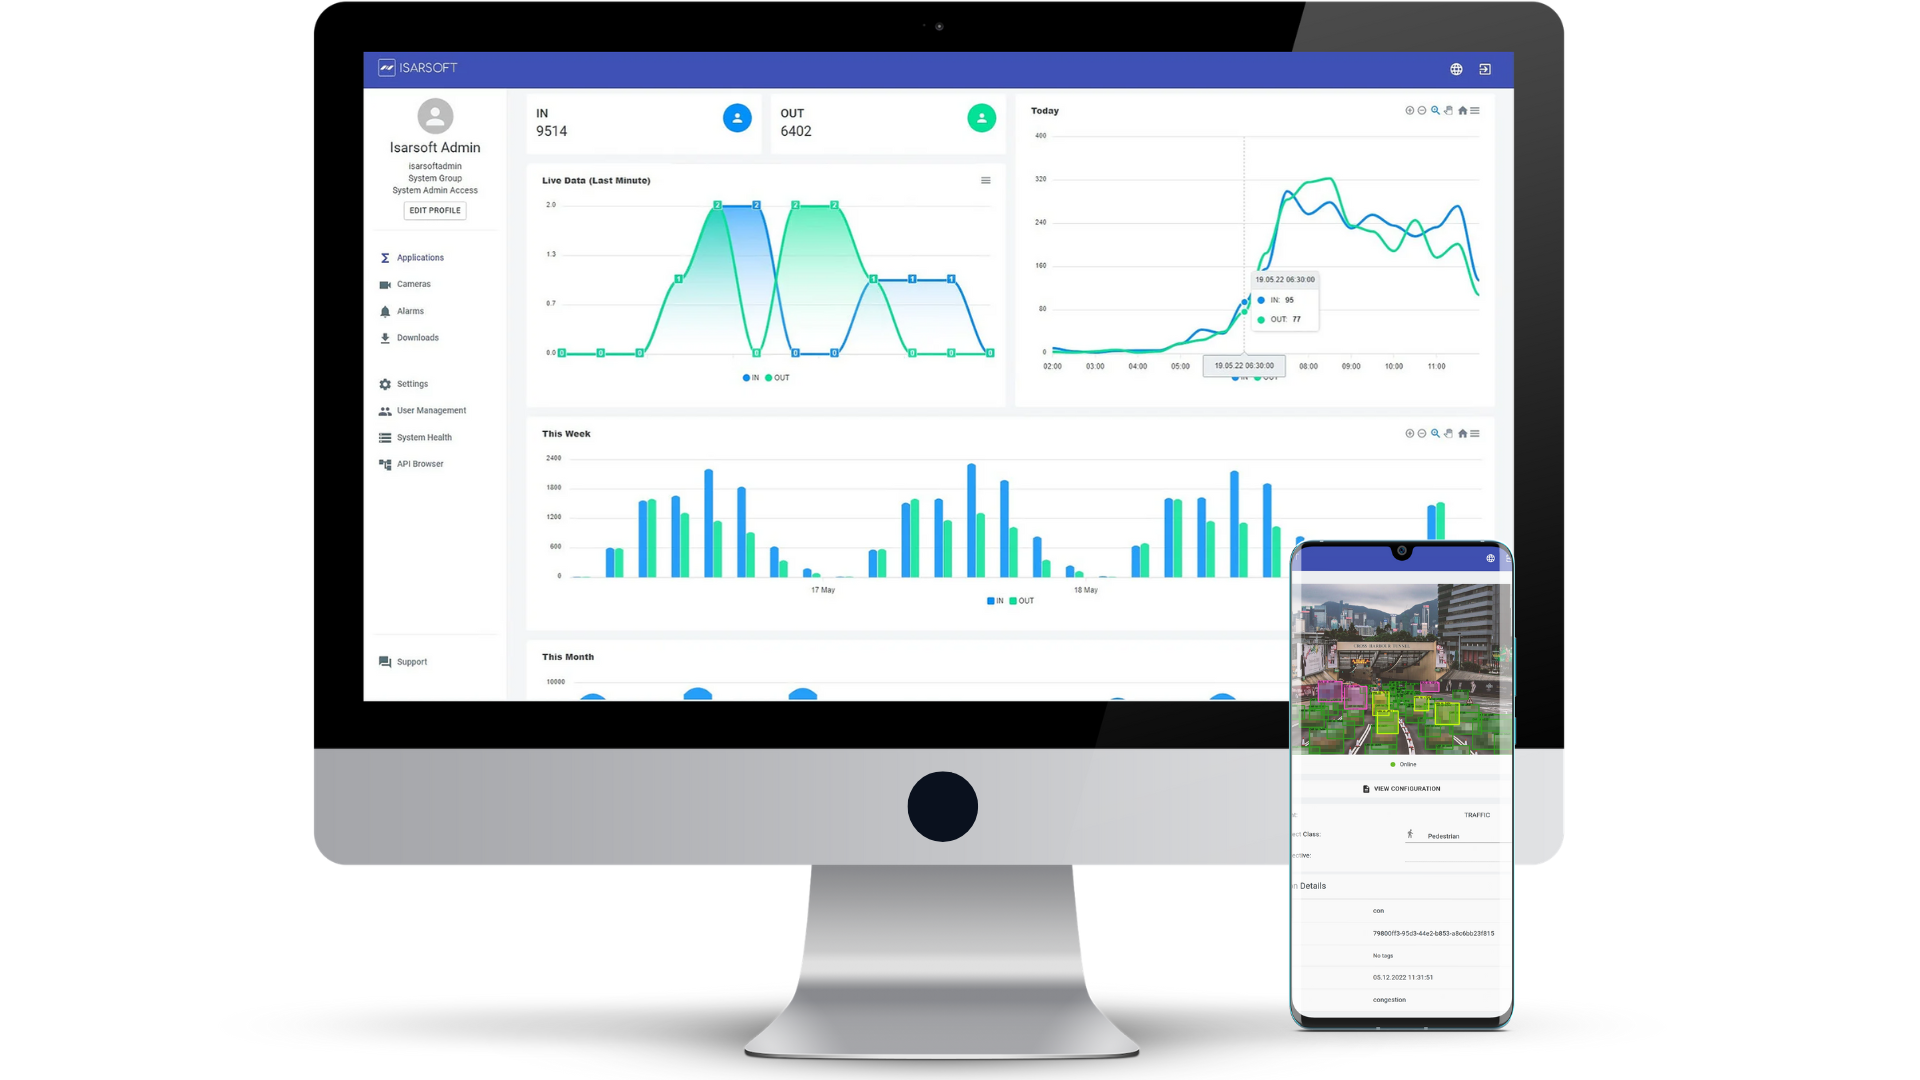
Footfall counters have come a long way since their inception, and are now capable of functioning in an autonomous manner. When in conjunction with video analytics tools such as Isarsoft Perception, they are most likely to be security cameras - configured to count people.

What else do retailers consider when measuring footfall?
- Accuracy - Accuracy is important. It depends on the chosen tech and vendor, with typical accuracy percentages being 90%, 95%, 98%, and 99%.
- Cost - It is essential that a footfall counter be chosen that is cost-effective. Total cost comprises three sections - installation, configuration, and maintenance. While video analytics tools have the advantage of existing security cameras in most cases, thermals require electric installation and require frequent updates.
- Integrations - A footfall counting system is often clubbed with video management systems, business intelligence (bi) or pos systems. Retailers tend to choose tools that allow easy integration.
- Other features - Merely the counting of people is not enough, it is also useful to have access to other metrics such as dwell time, velocity, customer demographics, etc.
Conversion Rate
When assessing the performance of a retail outlet, conversation rate is one of the primary metrics used by analysts. It is the ratio of the number of conversions to the number of visitors.
What is a conversion? Simply speaking and in the context of retail, it points to the number of purchases made. However, a sale is not the only conversion that is monitored by retailers - it can also point to the number of registrations for reward points programs, store memberships, and customers availing of in-store facilities such as F&B areas.
Marketing Efficiency Ratio (MER)
Marketing Efficiency Ratio (MER) is a metric used to measure how efficient the retail business’ marketing efforts are at driving sales.
MER is calculated by dividing the total sales revenue by total marketing spend. When investing a marketing budget of Xmarketing, the sales revenue is Xmarketing * MER.
A continuous measurement of MER helps to better estimate and understand the marketing budget needed to hit a given sales target. Video analysis or sensors can be used to assess the efficiency of marketing campaigns.
Average Transaction Value
Average Transaction Value (ATV) refers to the average amount a consumer spends on a single purchase. The calculation is done using a simple formula wherein the store's total revenue for a given period is divided by the total number of transactions in the same period.
Tracking ATV for a retail business is very important, and for a multitude of reasons. To start with, ATV is directly connected to the Return on Investment (ROI) of any business enterprise. Attracting and retaining customers is often a cost-intensive process, and if the ATV for every customer can be systematically increased then the ROI on marketing and sales endeavours is largely enhanced.
The knowledge of ATV is also useful when assessing the efficacy of a product strategy, because the average transaction value for every customer is a direct indication of whether the strategy is paying off in the context of sales. The same applies for pricing plans, with the ATV being instrumental in the evaluation process.
Sales per Square Foot
An important metric for brick and mortar retail stores, sales per square foot is evaluated in order to determine if the current use of space in the store is also the best. It is especially useful for businesses that operate in multiple locations, as it lets the analyst see how each store is performing based on the amount of space it has.

Average Wait Time
Average wait time, literally speaking, is the average amount of time a given customer in a queue has to wait in order to be able to make his or her purchase. Video analytics can be used to monitor queue lengths in different parts of the store, to give retailers an overview of the people flow rate, wait times, and infrastructure efficiency,
By using wait/dwell time as a relevant KPI, retailers can make decisions about the number of registers required to optimize the flow of customers from point of purchase (POP) to point of sale (POS). It can also be used to deploy floor staff more efficiently, and reduce congestion caused by ill-managed queues within the store.
.jpg)

Customer Intelligence
Customer intelligence refers to the process of gathering and analyzing information about customers to gain insights into their needs, preferences, behaviors, and feedback. It involves collecting and processing data from various sources such as sales records, customer interactions, surveys, social media, and other customer touchpoints to understand their buying habits, motivations, and expectations.
How to conduct Customer Intelligence
The following steps describe the process of conducting customer intelligence.
- Defining goals - It is important to set clearly defined, achievable goals before compiling customer data. The type of data to be collected depends on the type of objective.
- Identifying sources - Data can come from a variety of sources such as sales records, social media, surveys, in-person customer interactions, etc. Retailers must ensure that they do a thorough sweep of possible sources before they embark on the collection process.
- Organizing data - Methods such as statistical analysis and machine learning tools are used to organize large volumes of data, making the spotting of trends and patterns much easier.
- Build customer profiles - Having well-defined customer profiles is important to guarantee the success of targeted marketing campaigns. A well-structured customer profile will have demographic information such as age and gender, buying preferences, habits, etc.
- Segmentation - Customer groups can be clubbed together based on similarities in behavior or characteristics.
- Usage of predictive modelling - Predictive modelling is a mathematical tool that is used to predict the future in terms of consumer trends, demand, and customer needs. Gathering data about future possibilities can help retailers create viable solutions for upcoming customer needs.
- Action-oriented decisions - Customer insights are extremely relevant in the context of strategic decision-making and help retailers take quick, data-driven action.
Retailers can use video analytics to utilize this data to their benefit and curate marketing campaigns that will be/ have been shown to be popular with specific demographic groups. It can also be used to implement infrastructural changes to aid specific members, and create product offerings that address customer needs and pain points.
Customer Retention
Customer retention statistics or, the number of repeat customers a store gets, is an important KPI for retailers. This data is crucial in assessing customer satisfaction and loyalty, and whether customers wish to repurchase the product or service being offered.
Video analytics can help segregate new customers from regular ones, and identify areas that could do with improvements in order to enhance customer retention. It can also help detect underlying problems that act as obstacles in the path of the optimal in-store experience.
Customer Path Analysis
Path analysis, as a metric, is used to monitor the movement of customers in the store and analyze their trajectories as they move through the aisles, making their purchases. Path analysis provides an insight into factors such as the efficacy of product placement, popular products, and popular areas within the store.
By analyzing this KPI, retailers can optimize the layout of their store and improve the overall customer experience.
Inventory Turnover Ratio
Inventory Turnover Ratio refers to an efficiency ratio used to determine how efficiently the inventory of a store is being managed. Efficient inventory management is directly linked to loss prevention, and can aid retailers in ensuring that inventory less can be identified and detected in a speedy manner.
There are four broad categories under which in-store retail loss can be categorized:
- Customer Fraud - Inventory loss from customer fraud refers to incidents of theft or stealing by the customer.
- Employee Fraud - Inventory loss from employee fraud refers to incidents of theft or stealing by the employee.
- Damaged Products - This category is used to indicate products that are essentially unfit for sale owing to damage sustained within or outside the premises.
- Expired Products - This category pertains to products that expire before they can be sold.
An important benefit of employing video analytics on the premise is that retailers can use it to detect theft or vandalism in real time, and take quick action to prevent it. Most video analytics tools can be configured to set alarms that alert store personnel and allow them to respond immediately.
There are a few different methods using which an air-tight system of loss prevention can be established.
More about Isarsoft
With Isarsoft Perception, your camera systems become part of your business intelligence. Whether the goal is to increase efficiency, customer satisfaction or safety, Isarsoft Perception provides the insights needed for informed decisions.

Contact us, to learn more about how to turn security cameras into intelligent sensors.


