Traffic Flow Measurement and Optimization in 2023
A guide to Traffic Flow Measurement and Optimization in 2023 - what the terms embody, its various benefits, and changes in the field over the past year.
Published
May 24, 2023
What is traffic flow?
Traffic flow is a value/parameter that stands for the movement of different road users in a specific area. Transportation flow describes how long it takes the road user to get from a certain point to another. Besides that the rate and direction of movement, the number and types of vehicles or users, and the patterns of movement is analyzed. Traffic flow is affected by various factors, such as road design, traffic volume, vehicle speeds, weather conditions, and traffic control devices.
Hence, reasons for lagging flow can be either physical or environmental factors.
What is traffic flow measurement?
The term traffic flow measurements describes the process of quantifying and subsequently analyzing the motion of vehicles or other road users in a particular area. It is similar to people flow measurement, but used in a different context because of different objects, KPIs and different problems. The traffic is analyzed by the factors that are mentioned above. The analysis of vehicle classification and occupancy rate is summarized, besides the traffic data analysis, real-time monitoring is provided. The analysis is used for structural changes, forecasting incidents and thus improving safety.
Because of traffic flow measurement, upcoming events like traffic jams can be forecast and wrong constructions, missing signs, and street anomalies can be detected.
How is traffic flow measured?
Traffic flow can be measured with different devices, multiple kinds of sensors, GPS tracking and video cameras. The flow of road users is measured with different KPIs - speed does have an impact but is not the only value that matters. Values that have an impact on traffic flow besides speed are density and volume.
- Speed can be measured with the feature Georeferencing, which can analyze the movement of the object in km/h. Read our article about Georeferencing to improve traffic analysis.
- The factor density has to be determined with a zone. Create a zone for each lane, define the number of objects which indicates normal density and then a number which stands for a higher density. In the video above only three zones were created for four lanes, that is the case because the lanes on the left have the same direction.
- The volume or the street utilization is determined with a line. The line counts every object that passes it and thus can determine the volume.
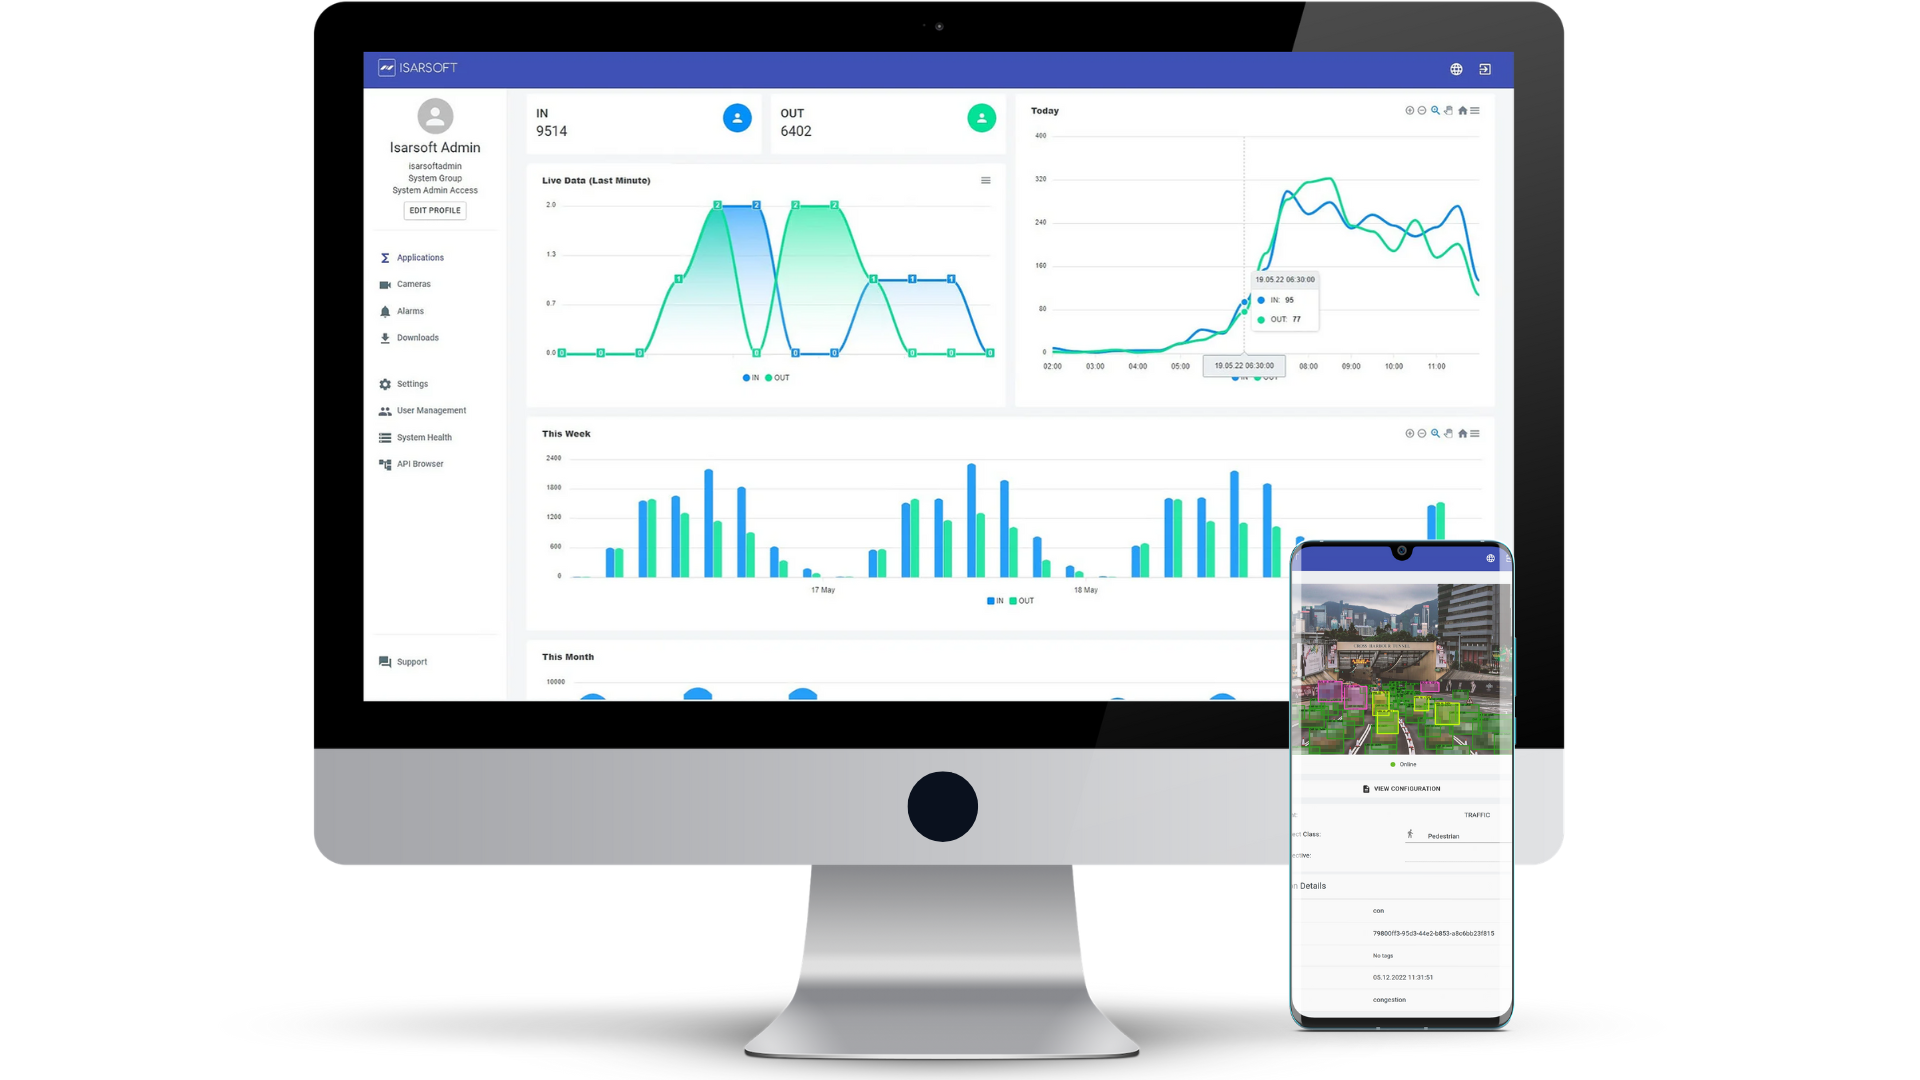
Within the measuring process, objects are monitored and the behavior of each is analyzed, for example the CPU and the Modal Split. The analyzed data of each gets summarized in the KPI´s. KPI are Key Performance Indicators which are the important values that have to be checked to improve the flow.

Within Isarsoft Perception the behavior can also get analyzed with different visualizations, the most important are listed below.
Visualization
A Visualization is a mode in which the Application can be displayed, all these different modes offer different benefits and thus can be used for different problems. Isarsoft Perception offers six different visualizations, read our article to learn more about each benefit.
Speed measurement
With the visualization “Velocity Map” the speed can be analyzed locally. The map shows in which area the road users mostly break and in which area the speed is the highest. This is the optimal feature for street anomaly detection but it also works perfect for traffic jam detection. When the map shows a different color scheme than usual, this is an indicator for congestion thus an occurring traffic jam.
In this example you can see that the vehicles in the lane in the middle are slowing down before it gets merged with the right lane. Areas in which the traffic is slower can be recognized by the blue color of the path.

Trajectory measurement
This visualization marks the start and end point with different colors, the points are connected with a line. This visualization can function as Wrong direction drivers detection. Wrong direction drivers can be detected by analyzing the points if a green point occurs in an area where usually the red points are.
Lines which have an unusual course in at a specific point can be the indicator for a street anomaly.
Dwell time measurement
The visualization “Dwell time Map” gives useful insights of where congestion appears often. Increased dwell time is often the result of traffic lights or traffic jam, thereby this feature is also useful for traffic jam detection.
Benefits of traffic flow measurement
The ability of forecasting specific incidents, recognizing anomalies of the street infrastructure and having an exact plan of the utilization are the reasons why traffic flow measurement is so important. These reasons have a huge impact on the safety, mobility and sustainability.
Street infrastructure
By analyzing the collected data structural changes can be planned more efficiently, governments and transportation planners get much better insights. The data of traffic flow measurement gives insights of the utilization and typical behavior of road users, which gives information about the needed capacity but also street anomalies.
Street anomalies are missing signs, street damages, and misleading road guidance. Existing infrastructure can be improved and new projects can be planned as efficiently as possible. Removing obstacles and generally improving the street infrastructure is making transportation much safer and easier to save resources, which is part of the plan for Smart Cities. New infrastructure plans have a much better foundation because the usage thus the requirements are known.
Less congestion
Congestion is reduced by knowing the patterns of the usual use of the roads, so traffic control systems can get adjusted. Congestion also can be avoided by improving the infrastructure or building it new, anomalies get detected easily by analyzing the data of the KPIs. Reducing congestion has a positive effect on efficiency, thus improving the economy by reducing cost and most importantly it improves sustainability.

Improving sustainability and life quality
Sustainability is improved because greenhouse gases which are the result of congestion are cut. Besides the effects emissions have on the environment, emissions also have negative effects on health. Several illnesses like asthma and cancer can be caused by bad/ low air quality.
Life quality is also improved by constructions which are time saving. Improving the street infrastructure for more comfort and better solutions is part of the Smart City movement. Smart city initiatives improve the life of its citizens with advanced technology to save resources. Data analytics is important for the used technologies in smart transportation systems.
Less Accidents
By recognizing behavior of the vehicles or road users in general patterns are created which can forecast congestion and accidents which can happen because of misleading road guidance and missing signs. The anomalies get detected by often occurring incidents in the same place. In the use case above a street anomaly could be a missing sign to reduce the speed for lane in the middle when the two lines get merged together. Preventing accidents is the main focus of vision zero, which is one goal of the EU. Read our Blog Post about Road Safety to learn more about this important topic.
What changed compared to last year?
Technology companies gained more trust of clients by improving the security of the technologies Companies that used modern technology, enabled more training for datasets, which improves the performance. More datasets are used and software or technology in general gets better with each year passing.
Besides that the integration with other technologies improved, this enables better insights into happenings. In this example an integration of sensors and thermometers is useful to understand casualties of traffic and weather conditions better.
How has Isarsoft Perception improved
This year Isarsoft Perception was updated to version v3. This version enables improved detection and classification of vehicles, which is beneficial for the Model Variant “Traffic”. Also the accuracy of the georeferencing was improved that made the velocity measurement much better, which was a huge improvement for the traffic measurement.

More about Isarsoft
With Isarsoft Perception, your camera systems become part of your business intelligence. Whether the goal is to increase efficiency, customer satisfaction or safety, Isarsoft Perception provides the insights needed for informed decisions.
Contact us, to learn more about how to turn security cameras into intelligent sensors.
Further References:
Explore More Publications
.avif)
Video Analytics or Sensors? Finding the best People Counting Tech for your Business
Do you want to improve your business by adopting a people counting solution but feel overwhelmed by the options? With video analytics and sensor-based technologies offering different advantages, choosing the right system can be challenging.
.png)
Who are your customers? Detection of age, gender, and group size in retail
Retail stores are often a blackbox when it comes to customer demographics. When POS checkout systems and customer loyalty programs do only reveal a part of the story, video analytics can now cluster store visitors in age groups and match them to male and female gender.
.avif)
How to: Customer Journey Analysis with Re-ID in Retail
Customer journey analysis with Re-ID provides the retail industry with precise data on footfall, customer behavior, and space utilization. Based on these insights, retailers can make smart decisions for both marketing and operations.