
Black Friday Retail Analytics: How to Plan, Run and Measure Your Biggest Store Day
Black Friday retail analytics helps store teams plan staff with footfall data, count passers-by, keep checkout queues short and prove in-store conversion. A before, during and after guide for retail operations and marketing managers.
Published
November 10, 2026

Key Facts
- Black Friday retail analytics turns a store's busiest day into measurable data: passers-by, footfall, conversion, queue times and occupancy.
- Black Friday remains the busiest in-store shopping day of the year: 80.3 million US consumers shopped in stores on Black Friday 2025 (NRF).
- Full city centers do not automatically mean full stores. The walk-in rate shows how many passers-by actually enter.
- Conversion rate is the clearest indicator of whether a Black Friday promotion paid off in store.
- Long checkout queues cost sales, because many shoppers avoid stores where they expect a wait.
- Comparing Black Friday with a baseline of normal weeks separates the promotion effect from seasonal growth.
- Existing security cameras can deliver all of these metrics without additional sensors.
Why is Black Friday a measurement problem?
Black Friday is a critical time of the year for brick-and-mortar retailers. It brings a surge in foot traffic and the chance for record sales. It also brings long checkout lines, crowded aisles, and more opportunities for theft.
The shopping pattern is changing, too. In Germany, the HDE expected €5.8 billion in Black Friday and Cyber Monday sales in 2025, the first decline since tracking began in 2016 (HDE via Handelsverband Bayern). In the US, a record 129.5 million consumers shopped in stores over the Thanksgiving weekend, yet Black Friday itself drew slightly fewer store visitors than the year before (NRF). Traffic is spreading across more days, and every visit counts.
For retail operations and marketing managers, this raises four questions: How many of the people crowding the shopping streets come into the store? Is the store staffed for the real peak? Do queues and crowding cost sales? And did the promotion pay off? This guide shows how AI video analytics answers each one, before, during and after Black Friday.
Before Black Friday: plan staff and stock with footfall data
Effective planning is essential on high-demand days. Footfall analysis shows when and where customers arrive, so stores can match staff and stock to real demand.
Build a baseline first
A Black Friday number means little on its own. Compare it with a baseline of four to six normal weeks before the event, and with the same weeks last year. This separates the promotion effect from seasonal growth or a rainy Saturday.
How to measure footfall with existing cameras
AI video analytics uses existing security cameras to count people. For small stores, one camera at the entrance is often enough. Lines and zones provide people counts, while heatmaps show which areas customers visit and where they spend most time. In Isarsoft Perception, anonymous re-identification counts each visitor once, even across several cameras, and staff are excluded from the counts automatically.
What to plan with the data
- Optimize staffing levels: Use footfall over time from previous peak days to see when each area hits its peak. Schedule staff where and when they are needed most, and avoid overstaffing quiet zones.
- Plan stock: Use footfall and dwell times by zone to forecast demand. Make sure popular deal items are well stocked and placed in high-traffic areas.
- Set thresholds in advance: Define maximum queue lengths and occupancy limits before the day. Alerts only help if everyone knows what happens when they fire.
During Black Friday: keep queues short, crowds safe and stock protected
On the day itself, real-time data lets store managers react within minutes.
Keep checkout lines short with queue management
Long lines are inevitable on Black Friday, but they are expensive: 39% of shoppers switch to a competitor or abandon their purchase when faced with a physical line (Waitwhile, 2025).
Queue management with AI video analytics measures queue lengths and waiting times in real time at checkouts, fitting rooms and service counters. Isarsoft's queue management software, for example, uses the cameras already installed above the checkout area.
- Monitor queue lengths: Track lines at checkouts, fitting rooms and service desks, and alert staff when a queue passes its threshold.
- Deploy additional staff: Open extra registers or move staff to the busiest area as soon as waiting times rise.
- Track average check-out time: See how long a checkout takes and where the process slows down.
- Reduce drop-offs: Shorter waits mean fewer shoppers leave the line, or the store, without buying.
Monitor occupancy for safety and comfort
Overcrowding is still a risk in flagship stores and malls, but it is one metric among several. Live occupancy counts show how many customers are in the store at once. Peak occupancy over time shows when the store reaches its limit, so managers can control entry before aisles become unsafe.
Protect margins with loss prevention
Peak hours overwhelm manual monitoring. AI video analytics detects behavior patterns typical of shoplifting, such as loitering in high-value aisles, and sends silent alerts to security staff. Loss prevention with Isarsoft Perception covers three areas:
- Self-checkout irregularities: Cross-reference visual movements with transaction data to flag unscanned items and "sweethearting".
- Back-of-house and loading docks: Detect unauthorized access and stock movement at irregular hours.
- Alerts where staff already work: Send notifications via mobile, dashboard or VMS such as Milestone XProtect or Genetec Security Center.
Detection is based on actions and events and does not identify individuals.
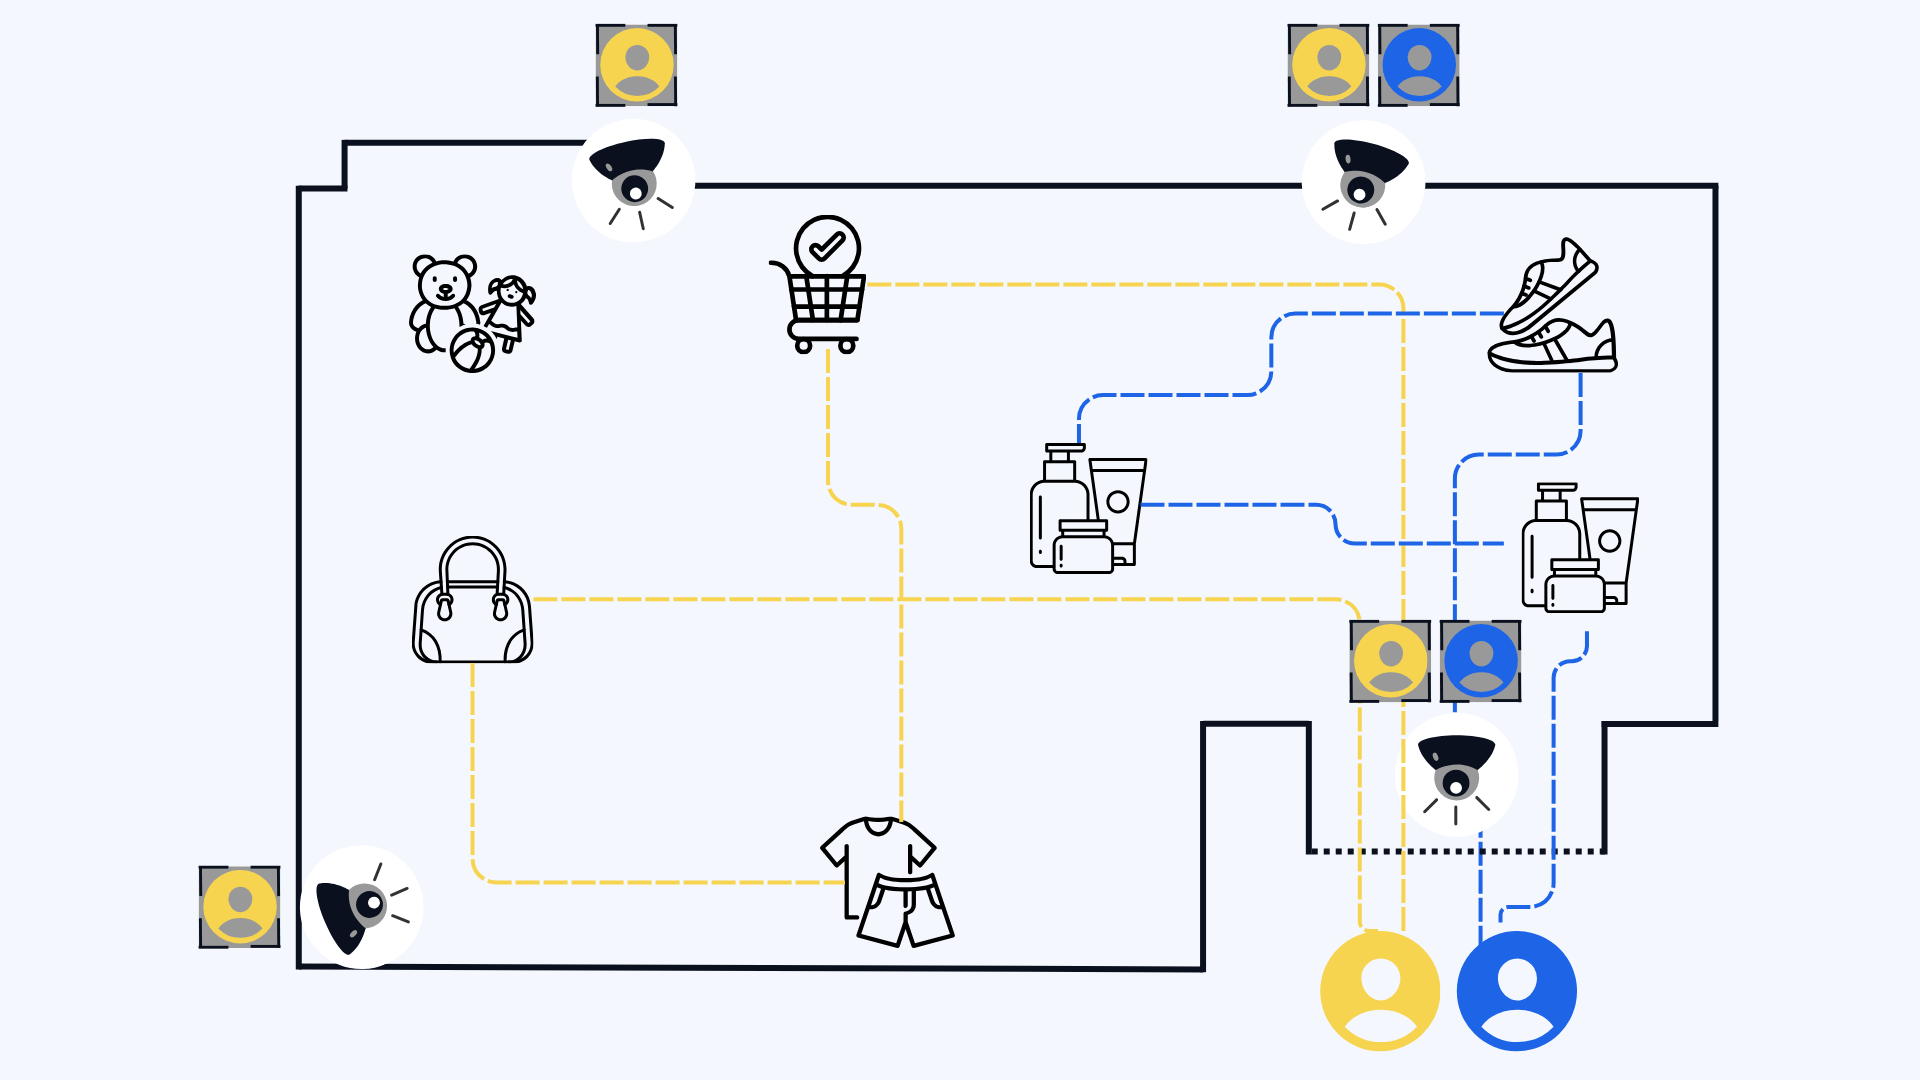
Optimize store layout for conversion
Store layout guides customer movement and influences what people buy. Strategic space optimization based on video analytics helps convert more of the Black Friday rush.
- Identify high-traffic zones: Heatmaps show where customers walk and where they stop. Place high-demand deals in visible, accessible spots.
- Reduce aisle congestion: Analyze customer flow to find bottlenecks, then adjust aisles and pathways.
- Strategic product placement: Put popular deals and impulse items where traffic and dwell times are highest.
- Optimize checkout placement: Position checkouts so queues do not block entrances, aisles or the exit flow.
After Black Friday: prove what the promotion achieved
The most valuable Black Friday retail analytics happens after the doors close. Only then can marketing and operations see whether discounts brought the right customers in and turned visits into sales.
Did the crowds in the city center reach the store?
On Black Friday, shopping streets and malls fill up. Whether that crowd turns into store visits is a separate question. Video analytics can count passers-by in front of the store as well as people entering it. The ratio of the two is the walk-in rate, also called capture rate.
If passers-by rise by 40% on Black Friday but entries only by 10%, the window display, the entrance or the visibility of the offer did not pull people in. If both rise in step, the promotion reached the street. A camera that covers the shop front is usually enough, and Isarsoft Perception reports the walk-in rate alongside total footfall.
For marketing teams, the walk-in rate is the link between outdoor and window campaigns and in-store results. For operations, a sudden jump in passers-by is an early signal that store traffic will follow.
Two ways to measure in-store conversion
The in-store conversion rate is the share of visitors who make a purchase. It is a core retail KPI because it reflects how well a store turns traffic into revenue. There are two ways to get it:
- Video analytics combined with POS data: Camera-based footfall is set against the number of transactions from the point of sale.
- Video analytics alone: The system detects purchase transactions at the checkout and relates them to the number of visitors. This works without a POS integration, which makes it faster to set up across many stores.
On Black Friday, conversion can drop even when sales rise, because more people browse without buying. Tracking conversion by hour shows whether the drop comes from window shoppers or from customers who gave up at the checkout queue.
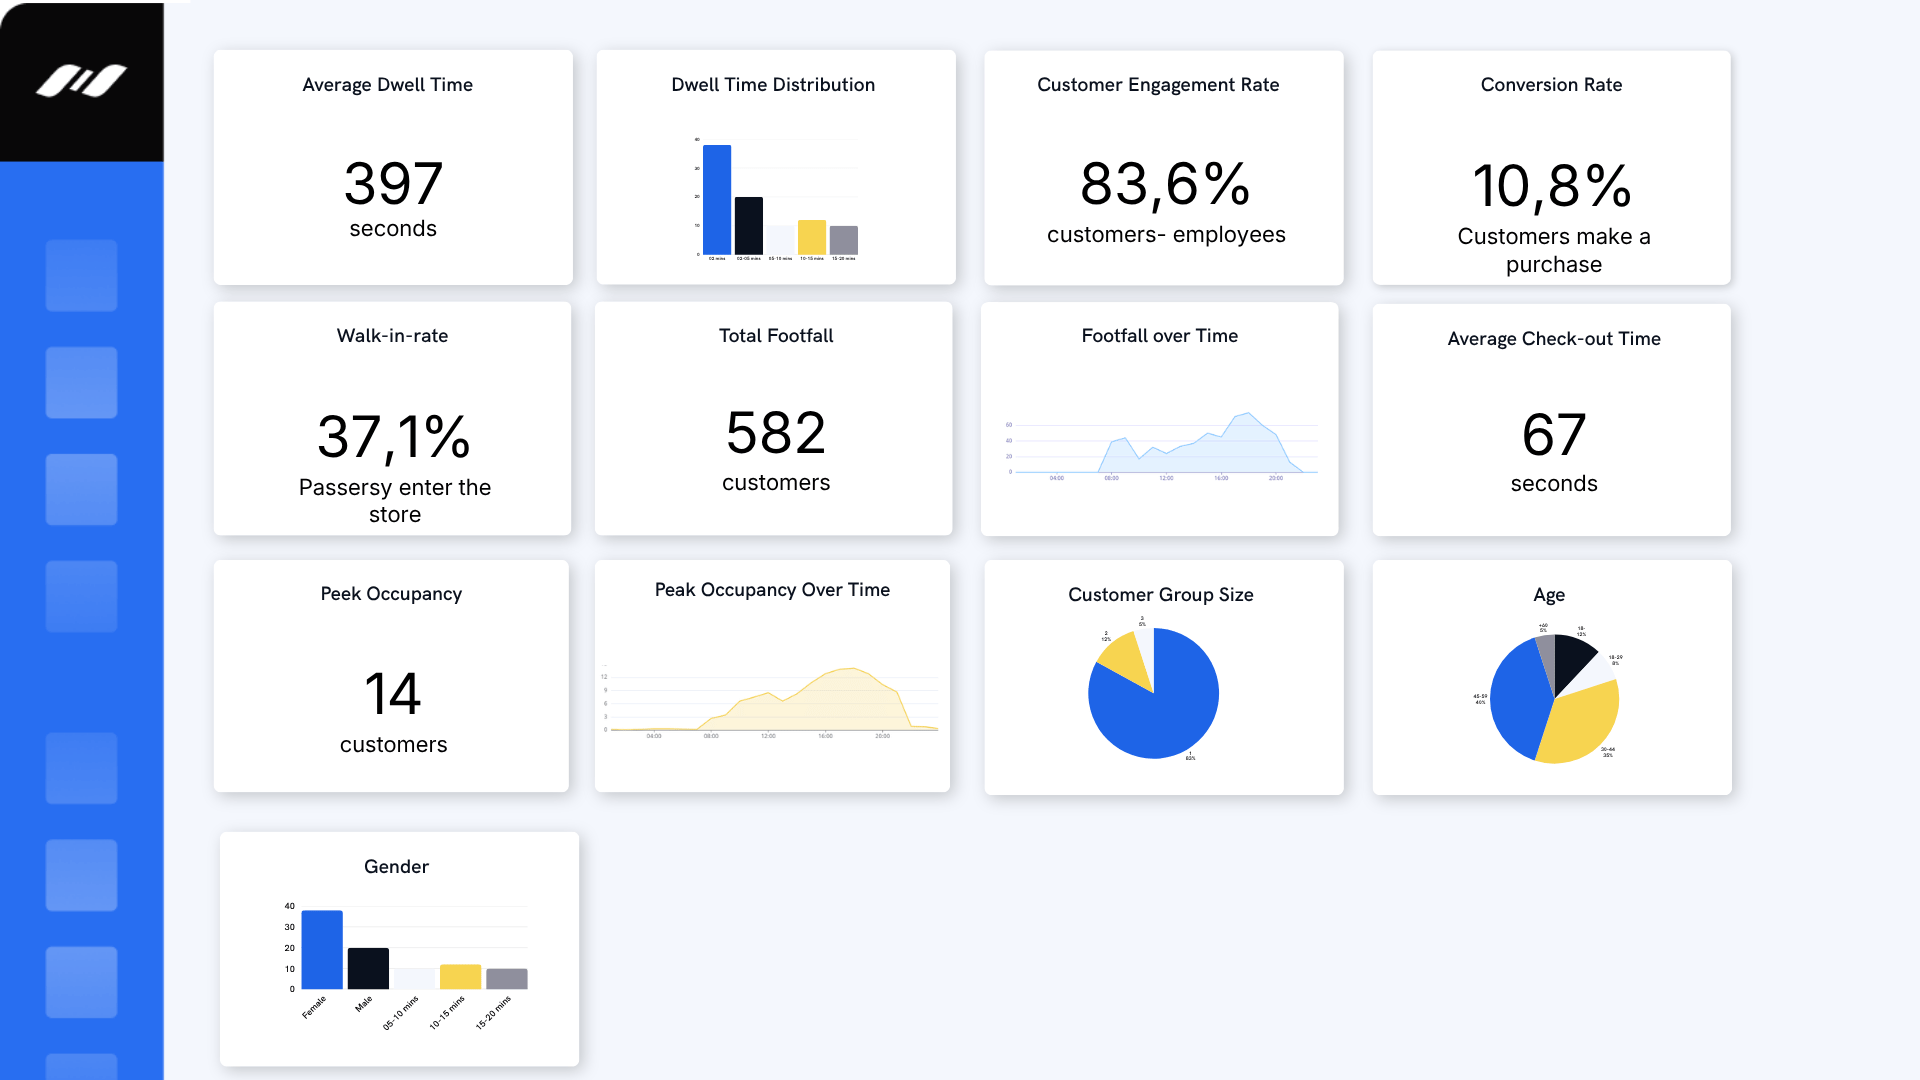
The Black Friday KPI set
All metrics can be derived from camera data, for example with Isarsoft Perception. Demographics such as age group, gender and group size are derived from anonymized video data.
Compare stores across the chain
For retail chains, the real insight lies in comparing locations. Comparative store performance analysis combines foot traffic, conversion rates and sales data across stores. It shows which locations converted the Black Friday crowd best, and which need different staffing, layouts or promotions next time.
From peak day to peak season
Black Friday is turning from a single day into a longer season. In 2025, the Sunday after Thanksgiving drew 27% more in-store shoppers than the year before, while Black Friday itself drew slightly fewer (NRF). Promotions also start earlier and last longer, so shoppers spread their purchases across several weeks.
For stores, this means peak management becomes a continuous process: Black Week, the Christmas weekends and the January sales. Retailers who measure every peak build a baseline that makes each next one easier to plan. They know when to add staff, which layouts convert and which promotions are worth the discount.
The tools to do this already hang from the ceiling in most stores. Video analytics turns existing security cameras into a source of footfall, conversion and queue data, without new hardware and in line with GDPR.
Ready to make your next peak measurable? See how Isarsoft Perception supports retail stores, from people counting to conversion analysis.
FAQ
Can't find the answer to your question?
Contact us now!
Was ist Black Friday Retail Analytics?
Black Friday Retail Analytics ist die Messung der Performance im stationären Handel an umsatzstarken Aktionstagen. Dazu gehören Besucherfrequenz, Conversion Rate, Wartezeiten, Belegung und Verweildauer. Händler nutzen die Daten, um Personal zu planen, in Echtzeit zu reagieren und Aktionen auszuwerten.
Which KPIs matter most on Black Friday?
Conversion rate matters most, because it links footfall to sales. Operations teams also need queue length, waiting time and peak occupancy. Marketing teams add passers-by, walk-in rate and footfall compared with a baseline.
How accurate are visitor counts on a crowded day?
Accuracy depends on two things: counting each person once and leaving staff out. Re-identification recognizes the same person across frames and cameras without identifying who they are, so a shopper who walks past several cameras is counted once. Staff are excluded automatically, because the system learns which individuals appear repeatedly over long periods. In crowded settings, video analytics tends to be more accurate than door sensors, which only register beam breaks.
Do you need new hardware for in-store analytics?
Usually not. Isarsoft Perception runs on existing security cameras and integrates with leading video management systems. For small stores, one camera at the entrance often delivers the core KPIs.
Is camera-based retail analytics GDPR compliant?
It can be, if the system anonymizes data. Isarsoft Perception processes video locally, does not use facial recognition and does not store faces or personal data. Isarsoft is ISO 27001 certified by TÜV Süd.
How long does it take to set up retail video analytics?
Setup typically takes four to eight weeks from purchase to operation. Larger projects can start with a proof of concept or pilot.
Explore More Publications

6 Reasons for Isarsoft Video Analytics
Isarsoft Perception turns existing security cameras into smart sensors that count people, track customer journeys and detect vehicles, with privacy built in. Here are six reasons why transit operators, airports, retailers and museums choose Isarsoft video analytics.
Artwork Protection at Kunstmuseum Stuttgart with Isarsoft
To protect priceless artworks without resorting to ropes, glass cases, or rigid sensor grids, Kunstmuseum Stuttgart implemented Isarsoft Perception's AI-powered video analytics software. By converting its existing security camera infrastructure into invisible, precision-tuned protection zones, the museum is able to automate artwork protection in real time.
Monitoring Occupancy and Seat Availability in Public Transportation
Passenger counts tell operators how many people are on board, not where the remaining capacity is or what kind it is. We look at how seat-level and multifunctional-area occupancy monitoring gives transport operators that missing data.
People Counting for Retail Stores
Understanding in-store traffic has become mission-critical for modern retailers. With smart people counting systems, businesses can track customer flow, identify peak times, and optimize both operations and space utilization.

How to Increase Conversion in Retail: A Complete Guide
Discover how to improve conversion in retail with AI video analytics. This ultimate guide explains how video insights boost brand awareness, drive sales, and optimize performance.
Optimizing the In-Store Journey with Retail Video Analytics
Want to optimize your retail business? Retail video analytics helps retailers improve layout, loss prevention, and customer experience.